Strava Stats
Strava is a social network where athletes can upload and compare training and races. Recently I’ve been working on a web app that provides some additional analyses and statistics to augment those provided by Strava. In this post I will highlight some of the interesting features and code involved in this project that was developed using the Flask framework for Python. The app is still under development but if you have any feedback I’d love to hear it on GitHub or by e-mail.
Table of Contents
Adjusting for Weather Conditions
Weather conditions such as wind, heat, or humidity can have a significant impact on running or cycling performance. Strava doesn’t provide any way to adjust performance data for these conditions which can make it harder to compared performances over time. I decided to see if I could do so by combining Strava data with an external weather data source. The Dark Sky API seemed like an ideal tool for this purpose because it provided an easy way to gather historical weather data using only latitude, longitude, and time. This meant that I could easily use the location and time data from my Strava data (collected by my GPS watch) and add weather data to it.
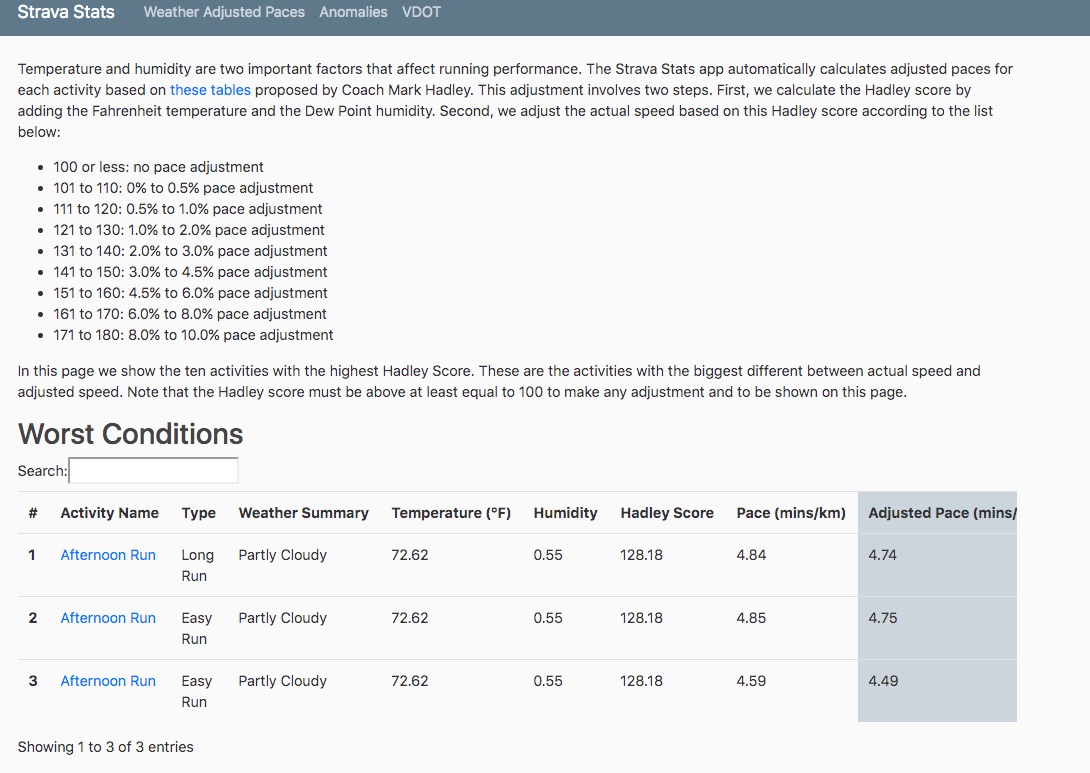
The next step was to find a suitable method to adjust performance based on this weather data. I decided to focus on the impact of temperature and humidity rather than wind initially because adjusting for wind speed is complicated by factors like direction. I found this method from Coach Mark Hadley that provides a quick and easy way to adjust running performance by combining humidity and temperature into a single score. For example, running in a temperature of 70.00 Fahrenheit and a Dew Point humidity of 0.55 would result in a Hadley Score of 127 which translates to a pace adjustment of 1-2% according to the tables developed by Coach Hadley. If we take 2% as the adjustment then this means that running 4 minutes and 30 seconds per km (4.5 mins per km) is equivalent to running about 4 minutes and 25 seconds per km (4.41 minutes per km) in these conditions. The resulting page in the Strava Stats app looks as follows:
VDOT Calculation
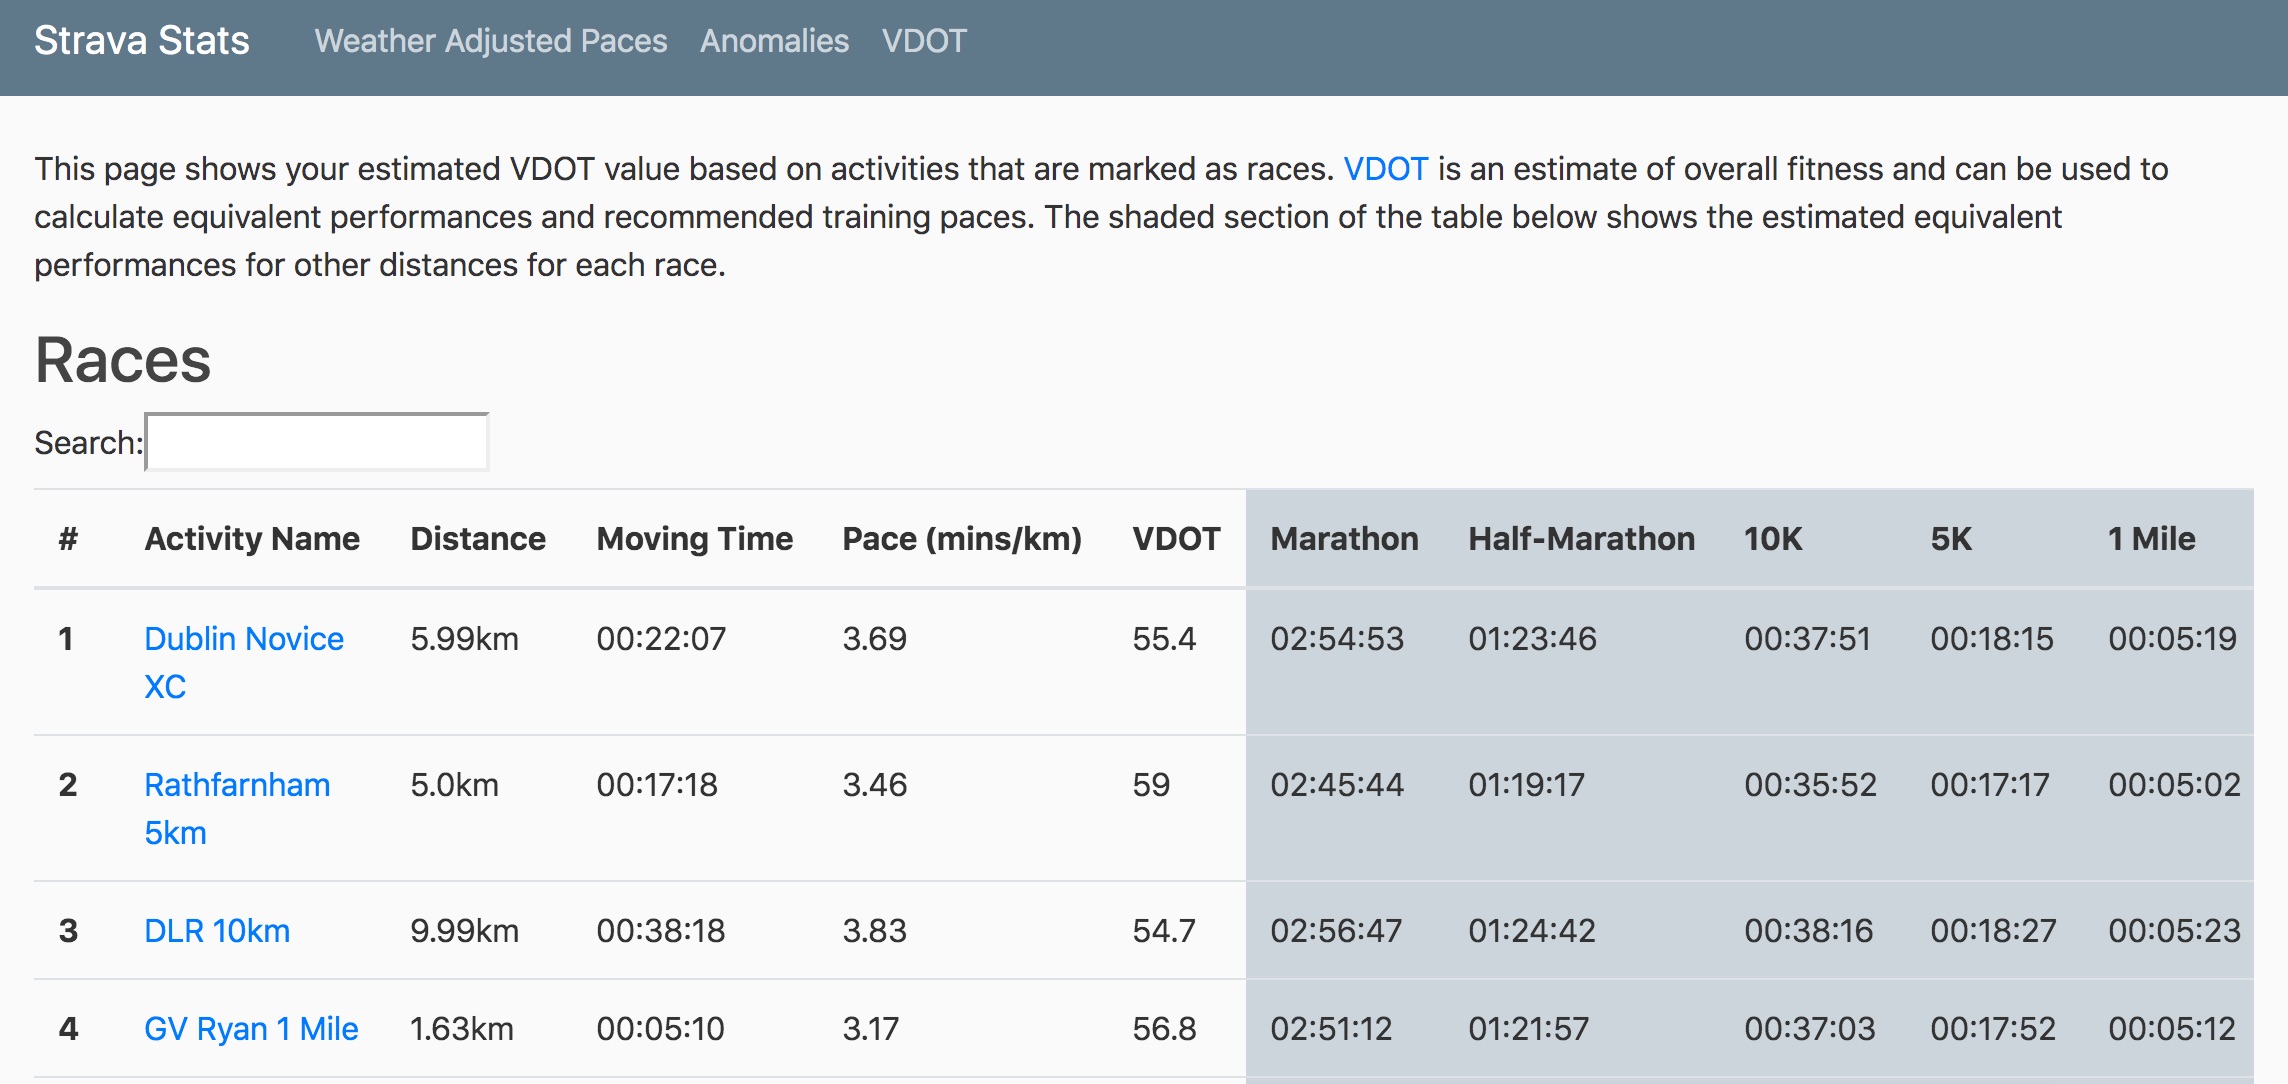
VDOT is an estimate of overall fitness and is used by many runners to calculate equivalent performances and recommended training paces. For example, if you recently ran a 5km race in 25 minutes you can calculate your VDOT as 38.3 using this VDOT calculator and find training paces and equivalent race performances for other distances for the same VDOT value. In the app I was developing I wanted to include a feature to automatically calculate the VDOT based on all activities that were uploaded to Strava and marked as races. This would allow you to estimate overall fitness at different points in time. One method of doing this would be to manually create VDOT tables in the source code but this would create a lot of extra code that I didn’t think was necessary. A second option is to embed the runsmartproject calculator into the app but this calculator didn’t fit with the overall style of the app and the user would also have to manually interact with the calculator rather than having the calculations performed automatically for them. My preferred option was an external API that I could call as necessary to make the calculations which would reduce the amount of code I had to write and maintain and mean that the user would not have to use the calculator themselves. I couldn’t find any suitable API but I did notice that using the runsmartproject calculator made a POST request to the https://runsmartproject.com/vdot/app/api/find_paces. I managed to replicate these POST requests in Python using the code below which meant that I could use this calculator like an API instead of having to embed it into the web app:
def calculate_vdot(distance_metres, moving_time):
    """
    Calculate VDOT using the runsmartproject calculator. There is no public
    API for this calculator so I reverse engineered how the POST request
    seems to work to get the VDOT calculations and equivalent race results
    """

    request_data = {
      'distance': round(distance_metres, -2) / 1000,
      'unit': 'km',
      'time': moving_time
    }

    vdot_data = requests.post('https://runsmartproject.com/vdot/app/api/find_paces',
                              data=request_data)

    return (vdot_data.json()['vdot'], vdot_data.json()['paces']['equivs'])
The VDOT page in the Strava Stats is shown in the screenshot below:
Progress Bar for Downloads
The Strava Stats app downloads data on each of the activities that you have uploaded to Strava and stores them locally in a SQLite database. This downloading can take a while if you have uploaded hundreds of activities. In the first version of the app the browser would simply wait for the download to complete with no indication of the progress but I decided that a better design would show a progress bar for the downloading. This proved to be more difficult to implement than expected. After doing some research I found that the best way of implementing this involved the following steps:
- In one thread start the downloading of the activity data
- Setup a Redis database and store a value for the progress of the download (percentage of downloads complete) in that database
- In a separate thread query the Redis database at regular intervals to get the progress percentage and show a progress bar based on this value
There is more detail on this process in the routes.py file in the Strava Stats source code.